
Inflation Calculator
Inflation Calculator with U.S. CPI Data
Determines the U.S. dollar’s equivalent value for any month between 1913 and 2025, using the average Consumer Price Index (CPI) for all urban consumers in the United States.
Inflation Calculator Results
Forward Flat Rate Inflation Calculator
Calculates an inflation based on a certain average inflation rate after some years.
Backward Flat Rate Inflation Calculator
Calculates the present-day purchasing power of a historical amount using a specified average inflation rate.
Related : Interest Calculator | Investment Calculator | Loan Calculator
The Inflation Calculator is a powerful tool designed to help you understand how the value of the U.S. dollar has changed over time. Using historical Consumer Price Index (CPI) data compiled by the U.S. government, this calculator allows you to convert the purchasing power of money from one year to another. Simply enter the amount you want to analyze, specify the year in which that amount was relevant, and then select the year for which you want to see the inflation-adjusted equivalent. This provides a clear, practical understanding of how inflation affects the value of money over different periods.
In addition to this standard calculation, the tool also includes specialized features like the Forward Flat Rate Inflation Calculator and the Backward Flat Rate Inflation Calculator. These calculators are particularly useful for hypothetical or theoretical scenarios, allowing you to determine how an amount would change in value over a specific number of years given a fixed inflation rate. By applying a consistent annual percentage increase or decrease, you can estimate future or past values of money with ease.
Historically, inflation in the United States and many other developed economies tends to average around 3% per year. This makes it a reasonable baseline for theoretical calculations. However, our calculators are fully adjustable, so you can enter any inflation rate you wish to reflect more accurate historical data or explore alternative scenarios. Whether you are planning for retirement, budgeting for long-term expenses, or simply curious about the changing value of money, this calculator provides a reliable and flexible way to put dollars in context across time.
By providing both historical insights and forward-looking projections, the Inflation Calculator serves as an educational and practical resource, helping you make informed financial decisions and better understand the real-world impact of inflation on everyday money.
Historical Inflation Rate for the U.S.
In the United States, the Bureau of Labor Statistics (BLS) releases the Consumer Price Index (CPI) on a monthly basis. This index measures changes in the prices of goods and services over time and can be used to calculate the corresponding inflation rate. Below is a historical record of U.S. inflation rates, reflecting changes in the value of the U.S. dollar from 2013 onward.
| Year | Jan | Feb | Mar | Apr | May | Jun | Jul | Aug | Sep | Oct | Nov | Dec | Average |
|---|---|---|---|---|---|---|---|---|---|---|---|---|---|
| 2025 | 3.00% | 2.82% | 2.39% | 2.31% | 2.35% | 2.67% | 2.70% | 2.92% | 3.01% | 2.74% | |||
| 2024 | 3.09% | 3.15% | 3.48% | 3.36% | 3.27% | 2.97% | 2.89% | 2.53% | 2.44% | 2.60% | 2.75% | 2.89% | 2.95% |
| 2023 | 6.41% | 6.04% | 4.98% | 4.93% | 4.05% | 2.97% | 3.18% | 3.67% | 3.70% | 3.24% | 3.14% | 3.35% | 4.12% |
| 2022 | 7.48% | 7.87% | 8.54% | 8.26% | 8.58% | 9.06% | 8.52% | 8.26% | 8.20% | 7.75% | 7.11% | 6.45% | 8.00% |
| 2021 | 1.40% | 1.68% | 2.62% | 4.16% | 4.99% | 5.39% | 5.37% | 5.25% | 5.39% | 6.22% | 6.81% | 7.04% | 4.70% |
| 2020 | 2.49% | 2.33% | 1.54% | 0.33% | 0.12% | 0.65% | 0.99% | 1.31% | 1.37% | 1.18% | 1.17% | 1.36% | 1.24% |
| 2019 | 1.55% | 1.52% | 1.86% | 2.00% | 1.79% | 1.65% | 1.81% | 1.75% | 1.71% | 1.76% | 2.05% | 2.29% | 1.81% |
| 2018 | 2.07% | 2.21% | 2.36% | 2.46% | 2.80% | 2.87% | 2.95% | 2.70% | 2.28% | 2.52% | 2.18% | 1.91% | 2.44% |
| 2017 | 2.50% | 2.74% | 2.38% | 2.20% | 1.87% | 1.63% | 1.73% | 1.94% | 2.23% | 2.04% | 2.20% | 2.11% | 2.13% |
| 2016 | 1.37% | 1.02% | 0.85% | 1.13% | 1.02% | 1.01% | 0.84% | 1.06% | 1.46% | 1.64% | 1.69% | 2.07% | 1.26% |
| 2015 | -0.09% | -0.03% | -0.07% | -0.20% | -0.04% | 0.12% | 0.17% | 0.20% | -0.04% | 0.17% | 0.50% | 0.73% | 0.12% |
| 2014 | 1.58% | 1.13% | 1.51% | 1.95% | 2.13% | 2.07% | 1.99% | 1.70% | 1.66% | 1.66% | 1.32% | 0.76% | 1.62% |
| 2013 | 1.59% | 1.98% | 1.47% | 1.06% | 1.36% | 1.75% | 1.96% | 1.52% | 1.18% | 0.96% | 1.24% | 1.50% | 1.47% |
| 2012 | 2.93% | 2.87% | 2.65% | 2.30% | 1.70% | 1.66% | 1.41% | 1.69% | 1.99% | 2.16% | 1.76% | 1.74% | 2.07% |
| 2011 | 1.63% | 2.11% | 2.68% | 3.16% | 3.57% | 3.56% | 3.63% | 3.77% | 3.87% | 3.53% | 3.39% | 2.96% | 3.16% |
| 2010 | 2.63% | 2.14% | 2.31% | 2.24% | 2.02% | 1.05% | 1.24% | 1.15% | 1.14% | 1.17% | 1.14% | 1.50% | 1.64% |
| 2009 | 0.03% | 0.24% | -0.38% | -0.74% | -1.28% | -1.43% | -2.10% | -1.48% | -1.29% | -0.18% | -1.84% | -2.72% | -0.34% |
| 2008 | 4.28% | 4.03% | 3.98% | 3.94% | 4.18% | 5.02% | 5.60% | 5.37% | 4.94% | 3.66% | 1.07% | 0.09% | 3.85% |
| 2007 | 2.08% | 2.42% | 2.78% | 2.57% | 2.69% | 2.69% | 2.36% | 1.97% | 2.76% | 3.54% | 4.31% | 4.08% | 2.85% |
| 2006 | 3.99% | 3.60% | 3.36% | 3.55% | 4.17% | 4.32% | 4.15% | 3.82% | 2.06% | 1.31% | 1.97% | 2.54% | 3.24% |
| 2005 | 2.97% | 3.01% | 3.15% | 3.51% | 2.80% | 2.53% | 3.17% | 3.64% | 4.69% | 4.35% | 3.46% | 3.42% | 3.39% |
| 2004 | 1.93% | 1.69% | 1.74% | 2.29% | 3.05% | 3.27% | 2.99% | 2.65% | 2.54% | 3.19% | 3.52% | 3.26% | 2.68% |
| 2003 | 2.60% | 2.98% | 3.02% | 2.22% | 2.06% | 2.11% | 2.11% | 2.16% | 2.32% | 2.04% | 1.77% | 1.88% | 2.27% |
| 2002 | 1.14% | 1.14% | 1.48% | 1.64% | 1.18% | 1.07% | 1.46% | 1.80% | 1.51% | 2.03% | 2.20% | 2.38% | 1.59% |
| 2001 | 3.73% | 3.53% | 2.92% | 3.27% | 3.62% | 3.25% | 2.72% | 2.72% | 2.65% | 2.13% | 1.90% | 1.55% | 2.83% |
| 2000 | 2.74% | 3.22% | 3.76% | 3.07% | 3.19% | 3.73% | 3.66% | 3.41% | 3.45% | 3.45% | 3.45% | 3.39% | 3.38% |
| 1999 | 1.67% | 1.61% | 1.73% | 2.28% | 2.09% | 1.96% | 2.14% | 2.26% | 2.63% | 2.56% | 2.62% | 2.68% | 2.19% |
| 1998 | 1.57% | 1.44% | 1.37% | 1.44% | 1.69% | 1.68% | 1.68% | 1.62% | 1.49% | 1.49% | 1.55% | 1.61% | 1.55% |
| 1997 | 3.04% | 3.03% | 2.76% | 2.50% | 2.23% | 2.30% | 2.23% | 2.23% | 2.15% | 2.08% | 1.83% | 1.70% | 2.34% |
| 1996 | 2.73% | 2.65% | 2.84% | 2.90% | 2.89% | 2.75% | 2.95% | 2.88% | 3.00% | 2.99% | 3.26% | 3.32% | 2.93% |
| 1995 | 2.80% | 2.86% | 2.85% | 3.05% | 3.19% | 3.04% | 2.76% | 2.62% | 2.54% | 2.81% | 2.61% | 2.54% | 2.81% |
| 1994 | 2.52% | 2.52% | 2.51% | 2.36% | 2.29% | 2.49% | 2.77% | 2.90% | 2.96% | 2.61% | 2.67% | 2.67% | 2.61% |
| 1993 | 3.26% | 3.25% | 3.09% | 3.23% | 3.22% | 3.00% | 2.78% | 2.77% | 2.69% | 2.75% | 2.68% | 2.75% | 2.96% |
| 1992 | 2.60% | 2.82% | 3.19% | 3.18% | 3.02% | 3.09% | 3.16% | 3.15% | 2.99% | 3.20% | 3.05% | 2.90% | 3.03% |
| 1991 | 5.65% | 5.31% | 4.90% | 4.89% | 4.95% | 4.70% | 4.45% | 3.80% | 3.39% | 2.92% | 2.99% | 3.06% | 4.25% |
| 1990 | 5.20% | 5.26% | 5.23% | 4.71% | 4.36% | 4.67% | 4.82% | 5.62% | 6.16% | 6.29% | 6.27% | 6.11% | 5.39% |
| 1989 | 4.67% | 4.83% | 4.98% | 5.12% | 5.36% | 5.17% | 4.98% | 4.71% | 4.34% | 4.49% | 4.66% | 4.65% | 4.83% |
| 1988 | 4.05% | 3.94% | 3.93% | 3.90% | 3.89% | 3.96% | 4.13% | 4.02% | 4.17% | 4.25% | 4.25% | 4.42% | 4.08% |
| 1987 | 1.46% | 2.10% | 3.03% | 3.78% | 3.86% | 3.65% | 3.93% | 4.28% | 4.36% | 4.53% | 4.53% | 4.43% | 3.66% |
| 1986 | 3.89% | 3.11% | 2.26% | 1.59% | 1.49% | 1.77% | 1.58% | 1.57% | 1.75% | 1.47% | 1.28% | 1.10% | 1.91% |
| 1985 | 3.53% | 3.52% | 3.70% | 3.69% | 3.77% | 3.76% | 3.55% | 3.35% | 3.14% | 3.23% | 3.51% | 3.80% | 3.55% |
| 1984 | 4.19% | 4.60% | 4.80% | 4.56% | 4.23% | 4.22% | 4.20% | 4.29% | 4.27% | 4.26% | 4.05% | 3.95% | 4.30% |
| 1983 | 3.71% | 3.49% | 3.60% | 3.90% | 3.55% | 2.58% | 2.46% | 2.56% | 2.86% | 2.85% | 3.27% | 3.79% | 3.22% |
| 1982 | 8.39% | 7.62% | 6.78% | 6.51% | 6.68% | 7.06% | 6.44% | 5.85% | 5.04% | 5.14% | 4.59% | 3.83% | 6.16% |
| 1981 | 11.83% | 11.41% | 10.49% | 10.00% | 9.78% | 9.55% | 10.76% | 10.80% | 10.95% | 10.14% | 9.59% | 8.92% | 10.35% |
| 1980 | 13.91% | 14.18% | 14.76% | 14.73% | 14.41% | 14.38% | 13.13% | 12.87% | 12.60% | 12.77% | 12.65% | 12.52% | 13.58% |
| 1979 | 9.28% | 9.86% | 10.09% | 10.49% | 10.85% | 10.89% | 11.26% | 11.82% | 12.18% | 12.07% | 12.61% | 13.29% | 11.22% |
| 1978 | 6.84% | 6.43% | 6.55% | 6.50% | 6.97% | 7.41% | 7.70% | 7.84% | 8.31% | 8.93% | 8.89% | 9.02% | 7.62% |
| 1977 | 5.22% | 5.91% | 6.44% | 6.95% | 6.73% | 6.87% | 6.83% | 6.62% | 6.60% | 6.39% | 6.72% | 6.70% | 6.50% |
| 1976 | 6.72% | 6.29% | 6.07% | 6.05% | 6.20% | 5.97% | 5.35% | 5.71% | 5.49% | 5.46% | 4.88% | 4.86% | 5.75% |
| 1975 | 11.80% | 11.23% | 10.25% | 10.21% | 9.47% | 9.39% | 9.72% | 8.60% | 7.91% | 7.44% | 7.38% | 6.94% | 9.20% |
| 1974 | 9.39% | 10.02% | 10.39% | 10.09% | 10.71% | 10.86% | 11.51% | 10.86% | 11.95% | 12.06% | 12.20% | 12.34% | 11.03% |
| 1973 | 3.65% | 3.87% | 4.59% | 5.06% | 5.53% | 6.00% | 5.73% | 7.38% | 7.36% | 7.80% | 8.25% | 8.71% | 6.16% |
| 1972 | 3.27% | 3.51% | 3.50% | 3.49% | 3.23% | 2.71% | 2.95% | 2.94% | 3.19% | 3.42% | 3.67% | 3.41% | 3.27% |
| 1971 | 5.29% | 5.00% | 4.71% | 4.16% | 4.40% | 4.64% | 4.36% | 4.62% | 4.08% | 3.81% | 3.28% | 3.27% | 4.30% |
| 1970 | 6.18% | 6.15% | 5.82% | 6.06% | 6.04% | 6.01% | 5.98% | 5.41% | 5.66% | 5.63% | 5.60% | 5.57% | 5.84% |
| 1969 | 4.40% | 4.68% | 5.25% | 5.52% | 5.51% | 5.48% | 5.44% | 5.71% | 5.70% | 5.67% | 5.93% | 6.20% | 5.46% |
| 1968 | 3.65% | 3.95% | 3.94% | 3.93% | 3.92% | 4.20% | 4.49% | 4.48% | 4.46% | 4.75% | 4.73% | 4.72% | 4.27% |
| 1967 | 3.46% | 2.81% | 2.80% | 2.48% | 2.79% | 2.78% | 2.77% | 2.45% | 2.75% | 2.43% | 2.74% | 3.04% | 2.78% |
| 1966 | 1.92% | 2.56% | 2.56% | 2.87% | 2.87% | 2.53% | 2.85% | 3.48% | 3.48% | 3.79% | 3.79% | 3.46% | 3.01% |
| 1965 | 0.97% | 0.97% | 1.29% | 1.62% | 1.62% | 1.94% | 1.61% | 1.94% | 1.61% | 1.93% | 1.60% | 1.92% | 1.59% |
| 1964 | 1.64% | 1.64% | 1.31% | 1.31% | 1.31% | 1.31% | 1.30% | 0.98% | 1.30% | 0.97% | 1.30% | 0.97% | 1.28% |
| 1963 | 1.33% | 1.00% | 1.33% | 0.99% | 0.99% | 1.32% | 1.32% | 1.32% | 0.99% | 1.32% | 1.32% | 1.64% | 1.24% |
| 1962 | 0.67% | 1.01% | 1.01% | 1.34% | 1.34% | 1.34% | 1.00% | 1.34% | 1.33% | 1.33% | 1.33% | 1.33% | 1.20% |
| 1961 | 1.71% | 1.36% | 1.36% | 1.02% | 1.02% | 0.68% | 1.35% | 1.01% | 1.35% | 0.67% | 0.67% | 0.67% | 1.07% |
| 1960 | 1.03% | 1.73% | 1.73% | 1.72% | 1.72% | 1.72% | 1.37% | 1.37% | 1.02% | 1.36% | 1.36% | 1.36% | 1.46% |
| 1959 | 1.40% | 1.05% | 0.35% | 0.35% | 0.35% | 0.69% | 0.69% | 1.04% | 1.38% | 1.73% | 1.38% | 1.73% | 1.01% |
| 1958 | 3.62% | 3.25% | 3.60% | 3.58% | 3.21% | 2.85% | 2.47% | 2.12% | 2.12% | 2.12% | 2.11% | 1.76% | 2.73% |
| 1957 | 2.99% | 3.36% | 3.73% | 3.72% | 3.70% | 3.31% | 3.28% | 3.66% | 3.28% | 2.91% | 3.27% | 2.90% | 3.34% |
| 1956 | 0.37% | 0.37% | 0.37% | 0.75% | 1.12% | 1.87% | 2.24% | 1.87% | 1.86% | 2.23% | 2.23% | 2.99% | 1.52% |
| 1955 | -0.74% | -0.74% | -0.74% | -0.37% | -0.74% | -0.74% | -0.37% | -0.37% | 0.37% | 0.37% | 0.37% | 0.37% | -0.28% |
| 1954 | 1.13% | 1.51% | 1.13% | 0.75% | 0.75% | 0.37% | 0.37% | 0.00% | -0.37% | -0.74% | -0.37% | -0.74% | 0.32% |
| 1953 | 0.38% | 0.76% | 1.14% | 0.76% | 1.14% | 1.13% | 0.37% | 0.75% | 0.75% | 1.12% | 0.75% | 0.75% | 0.82% |
| 1952 | 4.33% | 2.33% | 1.94% | 2.33% | 1.93% | 2.32% | 3.09% | 3.09% | 2.30% | 1.91% | 1.14% | 0.75% | 2.29% |
| 1951 | 8.09% | 9.36% | 9.32% | 9.32% | 9.28% | 8.82% | 7.47% | 6.58% | 6.97% | 6.50% | 6.88% | 6.00% | 7.88% |
| 1950 | -2.08% | -1.26% | -0.84% | -1.26% | -0.42% | -0.42% | 1.69% | 2.10% | 2.09% | 3.80% | 3.78% | 5.93% | 1.09% |
| 1949 | 1.27% | 1.28% | 1.71% | 0.42% | -0.42% | -0.83% | -2.87% | -2.86% | -2.45% | -2.87% | -1.65% | -2.07% | -0.95% |
| 1948 | 10.23% | 9.30% | 6.85% | 8.68% | 9.13% | 9.55% | 9.91% | 8.89% | 6.52% | 6.09% | 4.76% | 2.99% | 7.74% |
| 1947 | 18.13% | 18.78% | 19.67% | 19.02% | 18.38% | 17.65% | 12.12% | 11.39% | 12.75% | 10.58% | 8.45% | 8.84% | 14.65% |
| 1946 | 2.25% | 1.69% | 2.81% | 3.37% | 3.35% | 3.31% | 9.39% | 11.60% | 12.71% | 14.92% | 17.68% | 18.13% | 8.43% |
| 1945 | 2.30% | 2.30% | 2.30% | 1.71% | 2.29% | 2.84% | 2.26% | 2.26% | 2.26% | 2.26% | 2.26% | 2.25% | 2.27% |
| 1944 | 2.96% | 2.96% | 1.16% | 0.57% | 0.00% | 0.57% | 1.72% | 2.31% | 1.72% | 1.72% | 1.72% | 2.30% | 1.64% |
| 1943 | 7.64% | 6.96% | 7.50% | 8.07% | 7.36% | 7.36% | 6.10% | 4.85% | 5.45% | 4.19% | 3.57% | 2.96% | 6.00% |
| 1942 | 11.35% | 12.06% | 12.68% | 12.59% | 13.19% | 10.88% | 11.56% | 10.74% | 9.27% | 9.15% | 9.09% | 9.03% | 10.97% |
| 1941 | 1.44% | 0.71% | 1.43% | 2.14% | 2.86% | 4.26% | 5.00% | 6.43% | 7.86% | 9.29% | 10.00% | 9.93% | 5.11% |
| 1940 | -0.71% | 0.72% | 0.72% | 1.45% | 1.45% | 2.17% | 1.45% | 1.45% | -0.71% | 0.00% | 0.00% | 0.71% | 0.73% |
| 1939 | -1.41% | -1.42% | -1.42% | -2.82% | -2.13% | -2.13% | -2.13% | -2.13% | 0.00% | 0.00% | 0.00% | 0.00% | -1.30% |
| 1938 | 0.71% | 0.00% | -0.70% | -0.70% | -2.08% | -2.08% | -2.76% | -2.76% | -3.42% | -4.11% | -3.45% | -2.78% | -2.01% |
| 1937 | 2.17% | 2.17% | 3.65% | 4.38% | 5.11% | 4.35% | 4.32% | 3.57% | 4.29% | 4.29% | 3.57% | 2.86% | 3.73% |
| 1936 | 1.47% | 0.73% | 0.00% | -0.72% | -0.72% | 0.73% | 1.46% | 2.19% | 2.19% | 2.19% | 1.45% | 1.45% | 1.04% |
| 1935 | 3.03% | 3.01% | 3.01% | 3.76% | 3.76% | 2.24% | 2.24% | 2.24% | 0.74% | 1.48% | 2.22% | 2.99% | 2.56% |
| 1934 | 2.33% | 4.72% | 5.56% | 5.56% | 5.56% | 5.51% | 2.29% | 1.52% | 3.03% | 2.27% | 2.27% | 1.52% | 3.51% |
| 1933 | -9.79% | -9.93% | -10.00% | -9.35% | -8.03% | -6.62% | -3.68% | -2.22% | -1.49% | -0.75% | 0.00% | 0.76% | -5.09% |
| 1932 | -10.06% | -10.19% | -10.26% | -10.32% | -10.46% | -9.93% | -9.93% | -10.60% | -10.67% | -10.74% | -10.20% | -10.27% | -10.30% |
| 1931 | -7.02% | -7.65% | -7.69% | -8.82% | -9.47% | -10.12% | -9.04% | -8.48% | -9.64% | -9.70% | -10.37% | -9.32% | -8.94% |
| 1930 | 0.00% | -0.58% | -0.59% | 0.59% | -0.59% | -1.75% | -4.05% | -4.62% | -4.05% | -4.62% | -5.20% | -6.40% | -2.66% |
| 1929 | -1.16% | 0.00% | -0.58% | -1.17% | -1.16% | 0.00% | 1.17% | 1.17% | 0.00% | 0.58% | 0.58% | 0.58% | 0.00% |
| 1928 | -1.14% | -1.72% | -1.16% | -1.16% | -1.15% | -2.84% | -1.16% | -0.58% | 0.00% | -1.15% | -0.58% | -1.16% | -1.15% |
| 1927 | -2.23% | -2.79% | -2.81% | -3.35% | -2.25% | -0.56% | -1.14% | -1.15% | -1.14% | -1.14% | -2.26% | -2.26% | -1.92% |
| 1926 | 3.47% | 4.07% | 2.89% | 4.07% | 2.89% | 1.14% | -1.13% | -1.69% | -1.13% | -0.56% | -1.67% | -1.12% | 0.94% |
| 1925 | 0.00% | 0.00% | 1.17% | 1.18% | 1.76% | 2.94% | 3.51% | 4.12% | 3.51% | 2.91% | 4.65% | 3.47% | 2.44% |
| 1924 | 2.98% | 2.38% | 1.79% | 0.59% | 0.59% | 0.00% | -0.58% | -0.58% | -0.58% | -0.58% | -0.58% | 0.00% | 0.45% |
What is Inflation?
Inflation refers to the sustained rise in the overall price level of goods and services within an economy over a period of time, which results in a reduction in the purchasing power of money. In other words, as inflation increases, each unit of currency buys fewer goods and services than it did before. Inflation can occur naturally due to market forces such as increased demand or higher production costs, but it can also be influenced artificially through deliberate actions taken by authorities. Institutions such as central banks, governments, or historically even monarchs, have the ability to affect inflation by controlling the amount of money in circulation.
From a theoretical standpoint, when additional money is injected into an economy without a corresponding increase in the production of goods and services, the value of each individual unit of money declines. This happens because more money is competing for the same quantity of goods, leading sellers to raise prices. As a result, the general price level rises and inflation occurs. Central banks often manage this process by adjusting interest rates, regulating credit, or using other monetary policy tools to either stimulate or slow down economic activity.
The inflation rate is typically measured and reported as a percentage change in the average price level over a twelve-month period. This measurement allows economists and policymakers to track how quickly prices are rising and to assess the stability of the economy. Moderate inflation is generally viewed as a sign of a growing economy, while very high or unpredictable inflation can create uncertainty, reduce savings, and negatively impact living standards.
Most developed economies aim to maintain a low and stable inflation rate, usually in the range of approximately 2 to 3 percent per year. This target is considered optimal because it encourages consumer spending and investment while avoiding the risks associated with deflation or runaway inflation. Governments and central banks work together through fiscal and monetary policies such as government spending, taxation, and interest rate adjustments to achieve and sustain this balance.
Forward Flat Rate
A Forward Flat Rate refers to the exchange rate agreed upon today for a foreign currency transaction that will take place at a specified future date, where the forward rate is equal to the current spot rate. In this situation, the currency is said to be trading “flat” in the forward market because there is no forward premium or forward discount applied. This typically occurs when the interest rates of the two countries involved are very similar, eliminating any incentive for the forward rate to differ from the spot rate.
In foreign exchange markets, forward rates are largely influenced by interest rate differentials between countries. When one country has higher interest rates than another, its currency usually trades at a forward discount, while the lower-interest-rate currency trades at a forward premium. However, when interest rates are equal or nearly equal, the cost of holding either currency is the same. As a result, the forward exchange rate remains unchanged from the spot rate, producing a forward flat rate.
Forward flat rates are important for businesses and investors engaged in international trade or investment, as they provide certainty without additional cost related to interest rate differences. Companies can use forward contracts at a flat rate to hedge against exchange rate risk while knowing that they are not paying a premium or receiving a discount. Overall, a forward flat rate reflects balance in financial conditions between two economies and signals stability in the currency market.
Backward Flat Rate
A Backward Flat Rate refers to a situation in the foreign exchange market where the spot exchange rate is equal to the backward (or earlier-dated) forward rate, meaning there is no premium or discount applied for contracts settling in the near past or earlier period compared to the current spot rate. In practical terms, it indicates that the exchange rate for immediate delivery and the rate applicable to a recent or short-term period are the same, reflecting stability in the currency’s value over that time frame.
Backward flat rates usually occur when there has been little to no change in market conditions, such as interest rates, inflation expectations, or demand and supply for the currency. Since forward rates are influenced by interest rate differentials between countries, a backward flat rate suggests that these differentials have remained constant and that there is no advantage or disadvantage to holding one currency over another during that period. As a result, the exchange rate shows neither a forward premium nor a forward discount.
From a practical perspective, backward flat rates indicate short-term equilibrium in the foreign exchange market. For traders, investors, and businesses, this stability reduces uncertainty related to currency fluctuations for recent or immediate transactions. Although backward flat rates are less commonly discussed than forward premiums or discounts, they still serve as an indicator of balanced economic and financial conditions between two countries in the short run.
Hyperinflation
Hyperinflation is an extreme and uncontrollable rise in prices that causes the real value of a country’s currency to collapse at an exceptionally rapid pace. Unlike moderate inflation, which occurs gradually over time, hyperinflation accelerates so quickly that money loses its usefulness as a store of value, a unit of account, and even a medium of exchange. This phenomenon typically arises when a government dramatically increases the money supply without a corresponding increase in economic output or gross domestic product. When large amounts of money are printed or injected into the economy while the production of goods and services remains stagnant or declines, prices surge as too much money chases too few goods.
Historical examples clearly illustrate the devastating consequences of hyperinflation. In Ukraine during the early 1990s, following the collapse of the Soviet Union, economic instability and excessive money creation led to soaring prices and a near-total loss of confidence in the national currency. Similarly, Brazil experienced prolonged periods of hyperinflation between 1980 and 1994, during which prices rose so rapidly that the currency became practically worthless. In both cases, everyday life became extremely difficult for citizens. Many Ukrainians and Brazilians turned to more stable foreign currencies, such as the US dollar, to conduct transactions and preserve their wealth. Others attempted to protect themselves by investing in tangible assets or scarce resources, such as gold, which were more likely to retain value during times of economic chaos.
One of the most infamous episodes of hyperinflation occurred in Germany during the early 1920s. After World War I, the German government resorted to printing vast amounts of money in an attempt to stimulate the economy and meet its financial obligations. At the same time, Germany was burdened with enormous war reparations totaling 132 billion marks, further straining the economy. The combination of excessive money creation, heavy debt, and declining production led to a complete breakdown in economic activity. Goods became scarce, shortages spread, and prices spiraled out of control. At the peak of the crisis, prices were doubling approximately every three days. The German Papiermark lost so much value that it was reportedly used as wallpaper or even burned as fuel because it was cheaper than firewood. The social consequences were severe, with widespread poverty, loss of savings, and mass emigration as people fled in search of stability.
Despite the severe damage caused by hyperinflation, inflation itself is not inherently harmful when kept at moderate levels. In fact, low and stable inflation is generally considered beneficial for economic growth. When people expect money to lose a small amount of its value over time, they are encouraged to spend or invest rather than hoard cash. This behavior supports consumption, business investment, and overall economic activity. Therefore, while hyperinflation represents a failure of economic management with devastating consequences, controlled and predictable inflation plays an important role in maintaining a healthy and functioning economy.
Deflation
Although inflation can have both positive and negative effects depending on its severity and how well it is managed, deflation—the opposite economic condition is generally viewed as far more harmful and undesirable in most economies. Deflation occurs when there is a sustained and widespread decline in the prices of goods and services across the economy. At first glance, falling prices may seem beneficial to consumers, but over time deflation can create serious economic problems that outweigh any short-term advantages.
In a deflationary environment, consumers tend to delay spending because they expect prices to be lower in the future. When people believe their money will have greater purchasing power later on, they are more likely to save rather than spend. This reduction in consumer spending slows down economic activity, as businesses experience lower demand for their products and services. As revenues decline, companies may cut production, reduce wages, or lay off workers in order to survive, further weakening the economy.
Deflation can also stall or even reverse economic growth that would normally trend upward over time. With less money circulating through the economy, investment declines and unemployment rises, creating widespread economic uncertainty. One of the most well-known historical examples of deflation occurred during the Great Depression of the 1930s, which was characterized by a phenomenon known as the deflationary spiral. This concept explains how deflation can feed on itself and become increasingly difficult to escape.For real investment returns use are Investment Calculator.
The deflationary spiral begins when falling prices reduce business profits. With shrinking profits, firms cut back on spending, wages, and hiring. These reductions lead to lower household incomes, which in turn cause consumers to spend even less. As demand continues to fall, businesses are forced to lower prices further to attract buyers, reinforcing the cycle. This negative feedback loop can persist for years, making economic recovery extremely challenging without significant government intervention through fiscal stimulus or monetary policy.
Overall, while moderate inflation is often seen as a sign of a healthy, growing economy, deflation is usually associated with stagnation, rising unemployment, and prolonged economic hardship. For this reason, policymakers generally focus on preventing deflation and maintaining stable price levels to support sustainable economic growth.
Why Inflation Occurs?
Macroeconomic theories seek to explain the underlying causes of inflation and to identify the most effective ways to manage and control it. One of the most influential frameworks in this area is Keynesian economics, which dominated economic thought and policymaking in most developed countries throughout much of the twentieth century and continues to play an important role today. According to Keynesian theory, inflation and deflation are largely the result of significant imbalances between aggregate supply and aggregate demand in an economy. When demand for goods and services far exceeds supply, prices tend to rise, leading to inflation. Conversely, when supply outpaces demand, prices may fall, resulting in deflation.
Within this framework, economists generally identify several key types of inflation, each driven by different economic forces. One major form is cost-push inflation, which occurs when the costs of production increase and businesses pass these higher costs on to consumers in the form of higher prices. A common example is a rise in oil prices due to political instability or disruptions in supply. Since oil is a critical input for transportation, manufacturing, and energy production, an increase in its price raises operating costs across a wide range of industries. To maintain profitability, firms increase the prices of their goods and services, contributing to overall inflation.
Another important type is demand-pull inflation, which arises when aggregate demand in an economy grows faster than its productive capacity. This can happen during periods of strong economic growth, rising incomes, or expansionary fiscal and monetary policies that increase consumer and business spending. When too much money is chasing too few goods and services, producers respond by raising prices. In this case, inflation is driven not by higher costs, but by excess demand that the economy is unable to satisfy in the short run.
A third category is built-in inflation, also known as inertial or hangover inflation. This form of inflation is rooted in past economic conditions and continues into the present due to persistent expectations and institutional factors. Built-in inflation is closely connected to both cost-push and demand-pull inflation, as it reflects the cumulative effects of earlier price increases. One of its key mechanisms is the price–wage spiral, in which workers demand higher wages to keep up with rising living costs, and firms raise prices further to offset higher wage expenses. Additionally, inflationary expectations play a significant role, as consumers and businesses adjust their behavior based on the belief that prices will continue to rise, thereby reinforcing inflation over time.
Together, cost-push, demand-pull, and built-in inflation are considered the primary forces shaping the overall inflation rate in an economy. Macroeconomic theory emphasizes that understanding these different sources of inflation is essential for policymakers, as each type may require a different policy response. By carefully managing demand, controlling costs, and anchoring inflation expectations, governments and central banks aim to maintain price stability and promote long-term economic growth.
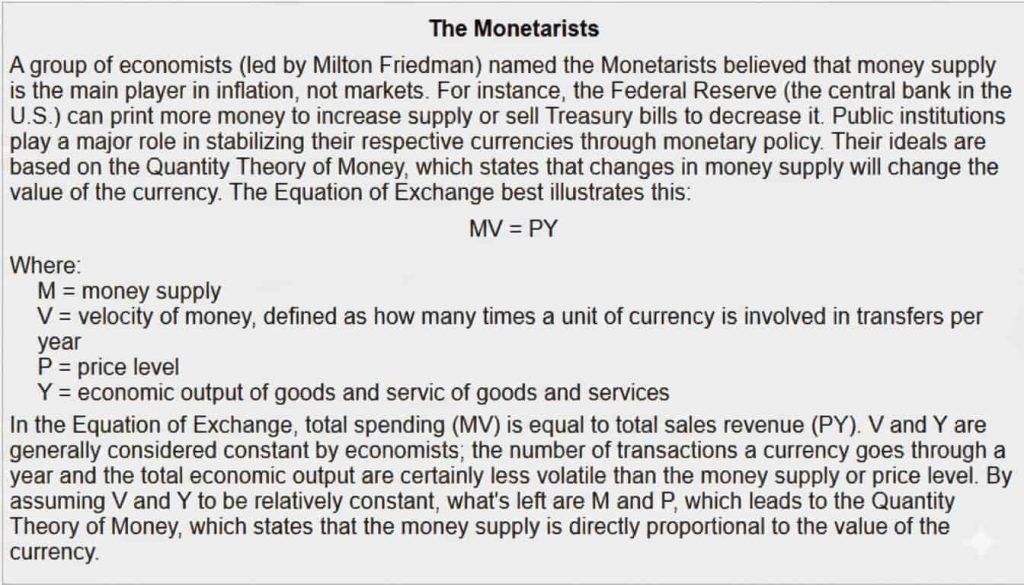
In practice, modern economic policy is rarely based on a single school of thought and instead reflects a combination of both Keynesian and Monetarist approaches. While Keynesians and Monetarists differ in their views on the primary drivers of economic stability and inflation, both schools acknowledge that elements of the other are necessary for effective policy-making. Keynesians, for example, recognize that the money supply plays an important role in influencing inflation and overall economic conditions, even if they place greater emphasis on government spending and demand management. Similarly, Monetarists, despite their strong focus on controlling the money supply, do not entirely dismiss the importance of influencing aggregate demand through fiscal measures. As a result, governments and central banks often adopt hybrid strategies, using both monetary tools and demand-side policies to address inflation,unemployment, and economic growth more effectively.
How is Inflation Calculated?
In the United States, inflation is measured and reported by the Department of Labor through its Bureau of Labor Statistics (BLS). To calculate inflation over time, the BLS constructs a representative “basket” of commonly purchased goods and services, such as food, housing, transportation, healthcare, and energy. The prices of these items are tracked regularly, and their costs are compared across different time periods. Because some goods and services make up a larger share of household spending than others, the data are carefully weighted and averaged using statistical formulas. The final result of this process is a widely used economic indicator known as the Consumer Price Index (CPI), which reflects changes in the overall cost of living.
To illustrate how inflation is calculated using the CPI, consider the change in prices between January 2016 and January 2017. The first step is to obtain the CPI values for both months from historical data published by the Bureau of Labor Statistics. In January 2016, the CPI stood at 236.916, while in January 2017 it had risen to 242.839.
Next, the difference between the two CPI values is calculated by subtracting the earlier figure from the later one, resulting in an increase of 5.923 points. This difference is then divided by the CPI value from the earlier period to determine the percentage change. When this calculation is performed, the result is approximately 2.5 percent. This means that, on average, prices increased by 2.5 percent between January 2016 and January 2017.
It is important to note that if the CPI for the earlier period is higher than the CPI for the later period, the calculation would yield a negative percentage. In such cases, the economy would be experiencing deflation rather than inflation, indicating an overall decline in average prices over time.
Problems with Measuring Inflation
Although the example above may suggest that calculating the Consumer Price Index (CPI) and inflation is a relatively straightforward process, the reality is far more complex. In practice, accurately measuring the true rate of inflation within an economy is a challenging task that involves many variables and assumptions. Inflation is not simply the result of prices rising uniformly; instead, it reflects a broad range of price movements across different goods and services, each influenced by unique factors.
One of the main difficulties in measuring inflation lies in determining the composition of the “basket” of goods and services used for comparison over time. Prices may increase not only due to inflation but also because of improvements in quality or technological advancement. For example, if the price of a computer rises significantly, it may not necessarily indicate inflation. Instead, the increase could be attributed to the introduction of advanced features, faster processing speeds, or innovative technology that enhances performance. Distinguishing between genuine inflation and price changes caused by quality improvements is often complicated and can lead to misleading conclusions.
Additionally, sudden and significant price changes in certain key commodities can distort inflation measurements. A sharp rise in oil prices, for instance, typically results in higher inflation figures because energy costs affect transportation, manufacturing, and distribution across many industries. However, such increases may be temporary, driven by geopolitical events or supply disruptions, and do not always reflect long-term inflationary trends. These short-term price shocks can create the false impression that overall inflation is higher or more persistent than it truly is.
Inflation also does not affect all individuals or groups in the same way. Different demographic groups experience inflation differently depending on their spending patterns and lifestyles. For example, higher fuel prices have a direct and substantial impact on truck drivers and individuals who rely heavily on transportation for their livelihoods. In contrast, stay-at-home parents or individuals with limited travel needs may feel the effects of rising fuel costs to a much lesser extent. As a result, a single inflation figure may not accurately represent the experiences of all segments of the population.
While CPI remains the most widely used measure of inflation, several alternative indices exist to address specific analytical needs. In the European Union, CPI was previously referred to as the Harmonized Index of Consumer Prices (HICP), which allows for consistent inflation comparisons across member states. Another variation, CPIH, incorporates housing-related costs such as mortgage interest payments so use are Mortgage payment tool for calculating mortgage,offering a more comprehensive picture of household expenses. CPIY, on the other hand, excludes indirect taxes like value-added tax (VAT) and excise duties, making it useful for analyzing inflation trends without the influence of short-term tax changes. Excise duties are taxes levied on goods produced domestically and can temporarily inflate prices without reflecting underlying economic conditions.
Furthermore, CPILFENS also known as the Consumer Price Index for All Urban Consumers Less Food and Energy is considered a more stable measure of inflation. By excluding food and energy prices, which are highly volatile, this index aims to provide a clearer view of long-term inflation trends. Food prices, for example, can fluctuate dramatically due to weather conditions, natural disasters, or changes in agricultural supply, while energy prices are often influenced by global market forces. Removing these volatile components helps reduce distortions and provides a more accurate representation of underlying inflationary pressures.
How to Beat Inflation?
Inflation is often considered one of the most silent yet significant threats to personal wealth, and its effects are particularly pronounced for individuals who hold substantial amounts of liquid cash that is sitting idle and not earning any return. Liquid cash refers to money in checking accounts, savings accounts with minimal interest, or simply cash stored at home. While it may feel secure, the reality is that inflation steadily erodes its purchasing power over time. For instance, suppose the inflation rate is 2.5%. In such a scenario, a checking account containing $50,000 that does not generate interest would lose $1,250 in real value by the end of the period. This demonstrates that even moderate inflation can slowly diminish the value of money if it remains idle. Over time, the cumulative effect of inflation can become substantial, highlighting the importance of proactive financial planning.
This fundamental principle explains why financial advisors and experts often caution against hoarding cash and instead recommend spending, investing, or otherwise allocating money in ways that preserve or enhance its value. In modern economies where moderate inflation is the norm, individuals face limited choices. One option is to spend money on goods or services immediately, though this comes with trade-offs regarding savings and future financial security. Another option is to invest in assets that have historically outpaced inflation, such as stocks, real estate, or other financial instruments. The third option, which is often the least favorable, is to accept the gradual erosion of wealth due to inflation. In reality, doing nothing and leaving money in a non-interest-bearing account is essentially a slow, hidden tax on savings.
Unfortunately, there is no single investment or strategy that can serve as a perfect hedge against inflation. Many investors pursue a combination of assets to reduce risk while attempting to protect purchasing power. Common hedging options include real estate, stocks, mutual or exchange-traded funds (ETFs), commodities like gold or oil, Treasury Inflation-Protected Securities (TIPS), and tangible collectibles such as art, antiques, or rare items. Each of these asset classes has unique advantages and disadvantages. For example, real estate can provide both income and appreciation potential but may be illiquid and require ongoing maintenance. Stocks may deliver high long-term returns but are subject to market volatility. Commodities and TIPS, however, are more directly linked to inflation, making them particularly relevant when considering protection against rising prices.
Commodities
One of the most historically popular approaches to guarding against inflation is investing in commodities. Commodities are tangible assets with intrinsic value, including precious metals such as gold and silver, energy resources like oil, industrial metals such as copper, and agricultural products like wheat or coffee. The appeal of commodities lies in their ability to retain value even as the purchasing power of money declines.
During periods of high inflation, demand for commodities often increases because investors and consumers perceive them as safe stores of value. For example, gold has been considered a reliable hedge against inflation for centuries. Its scarcity, durability, and global acceptance make it a preferred choice among investors seeking to protect their wealth. Unlike paper currency, gold cannot be printed or devalued through monetary policy, which further enhances its appeal. Other precious metals, such as silver and platinum, may also serve as inflation hedges, though they tend to be more volatile.
It is important to note that not all commodities behave uniformly. For instance, oil prices can be highly sensitive to geopolitical events or supply disruptions, causing significant short-term price swings. Similarly, agricultural commodities are affected by seasonal cycles, weather conditions, and global supply-demand imbalances. Consequently, while commodities can provide a hedge against inflation, they also introduce their own risks, making diversification within the commodity sector essential.
Treasury Inflation-Protected Securities (TIPS)
In addition to commodities, government-issued securities designed to combat inflation can play a valuable role in a diversified portfolio. In the United States, Treasury Inflation-Protected Securities (TIPS) are a unique type of bond issued by the U.S. Treasury to provide explicit protection against inflation. The principal of TIPS is adjusted based on inflation rates as measured by indices such as the Consumer Price Index (CPI). As inflation rises, the value of the principal increases, ensuring that the investor's purchasing power is maintained. Interest payments are then calculated on the adjusted principal, providing a return that reflects current inflation conditions.
TIPS are typically considered low-risk Plan for investments and are widely used to preserve capital in an inflationary environment. They are often included as a small portion of an investor’s overall portfolio, although individuals seeking stronger inflation protection can allocate a larger share of their portfolio to these instruments. One notable advantage of TIPS is their low correlation with stocks, which makes them an effective tool for portfolio diversification. While equities may offer higher long-term returns, they also carry greater volatility, so combining them with TIPS can balance risk and protection against inflation.
Another benefit of TIPS is their ability to earn term premiums over extended periods without the risk of inflation eroding returns, unlike conventional bonds. Other countries also provide inflation-indexed securities, offering similar protection for global investors. For example, the United Kingdom issues index-linked gilts, Mexico offers Udibonos, and Germany provides Bund index-linked bonds. These instruments function similarly to TIPS, adjusting principal based on inflation to ensure the preservation of real value over time.
Diversification and Strategy
While commodities and TIPS are commonly discussed in relation to inflation, prudent investors recognize that no single asset class provides complete protection. The most effective strategy typically involves diversification across multiple types of assets. Real estate, for instance, may appreciate in value along with inflation while also providing rental income. Stocks and equity funds can deliver long-term growth that outpaces inflation, though with higher volatility. Tangible assets like collectibles or fine art can also retain value during inflationary periods, although they tend to be illiquid and require specialized knowledge.
Ultimately, the key takeaway is that active financial management is essential in an inflationary environment. Holding cash without earning interest guarantees a gradual loss of purchasing power, whereas thoughtfully selected investments can preserve or even grow wealth over time. Individuals should consider their risk tolerance, investment horizon, and financial goals when constructing a portfolio designed to weather inflationary pressures. By combining multiple strategies including commodities, inflation-protected securities, equities, and real estate investors can create a more resilient portfolio capable of maintaining purchasing power in the face of rising prices.
Frequently Asked Questions
What is an inflation calculator?
An inflation calculator is an online tool or software that helps you estimate how the value of money changes over time due to inflation. It calculates how much a certain amount of money today will be worth in the future or how much past money is equivalent to today’s value. It uses official inflation data, usually from indices like the Consumer Price Index (CPI).
How to inflate a Presta valve?
A Presta valve is commonly found on road bikes and some mountain bikes. To inflate it:
- Unscrew the small nut at the top of the valve stem.
- Press the valve briefly to release any trapped air.
- Attach a bike pump compatible with Presta valves.
- Pump air into the tire until it reaches the recommended pressure.
- Unscrew the pump and tighten the small nut back down to close the valve.
How to figure out the inflation rate?
The inflation rate measures how much prices have increased over a period, usually a year. It can be calculated using the formula:
For example, if last year’s CPI was 250 and this year it is 255:
How to lower inflation?
Inflation is primarily controlled by governments and central banks. Common measures include:
- Increasing interest rates to reduce borrowing and spending.
- Reducing government spending to lower demand.
- Increasing production of goods and services to balance supply and demand.
- Controlling money supply to prevent excess liquidity in the economy.
For individuals, you can “lower the impact” of inflation by investing in assets that grow faster than inflation, like stocks, real estate, or TIPS.
What is the value of 1 lakh after 30 years?
Assuming an average annual inflation rate of 6%, 1 lakh today will be worth much less in 30 years in terms of purchasing power. Using the formula:
This means 1 lakh today will have the purchasing power of roughly ₹17,400 in 30 years.
How much will $50,000 be worth in 30 years of inflation?
Assuming an average inflation rate of 3% per year:
So $50,000 today will have the purchasing power of about $20,500 in 30 years.
How much would $100,000 in 1980 be worth today?
Using U.S. inflation data, the cumulative inflation from 1980 to 2026 is roughly 245%.
So $100,000 in 1980 is equivalent to around $345,000 today in terms of purchasing power.
How much is a 1994 dollar worth today?
From 1994 to 2026, the cumulative inflation in the U.S. is approximately 108%.
So $1 in 1994 is roughly equal to $2.08 today.
What is the EMI for 1 crore for 20 years?
EMI (Equated Monthly Installment) depends on the interest rate. Using a simple example of 8% annual interest:
Where:
- P = Principal (1 crore = 10,000,000)
- r = monthly interest rate (8%/12 = 0.006667)
- n = total months (20 × 12 = 240)
Plugging in:
Who benefits from inflation?
ome groups may benefit from inflation:
- Debtors or borrowers: They repay loans with money that is worth less than when they borrowed it.
- Owners of real assets: Property, gold, or commodities often rise in value with inflation.
- Businesses with pricing power: Companies that can increase prices faster than costs may maintain profits.
However, people holding cash or fixed incomes generally lose purchasing power.
How long will my retirement savings last with an inflation calculator?
An inflation-adjusted retirement calculator helps estimate how long your savings will last, considering spending patterns and expected inflation. For example:
- If you retire with $1 million and plan to spend $50,000 per year, assuming 3% annual inflation, your savings may last about 25–30 years.
- Using such calculators, you can adjust your withdrawal rate or investment growth to ensure your retirement funds keep pace with inflation.